


At Clever Cloud, we think it’s important to offer access to our metrics for our users. That’s why you can already query all our metrics, and can choose between WarpScript or PromQL. Besides, we wanted to provide more than only a metrics access to our users! We wanted to give a tool that will make you able to explore and visualize the state of your Clever Cloud applications. Internally, we’re using Grafana a lot to build monitoring dashboards, what if we can re-use this tool and build dedicated dashboards? That’s how we got the idea to release a Grafana for all of you!

In this blog post, we will talk about the Grafana tool. Then we will see how we deployed it. After that we will detail all actions to do to activate our Grafana Beta on your organisation. We will conclude with our dashboard’s contents.
About Grafana
Grafana is an open-source tool which enables among others applications metrics, alerting or log visualization. Thus Grafana’s aim is to ease to create efficient dashboards. Grafana also comes with multiple kinds of tiles or themes and provide many data sources. In our case, we will use only Warp10 and Prometheus.
Grafana at Clever Cloud
For the one who wants to utilize Grafana, it’s easy to deploy it today on Clever Cloud. For the French reader you can follow this blog post. And also we released some scripts to automate it on Github. When we wanted to deploy a Grafana for our customers, we decided to re-use the same scripts. This is why our deployed instance runs as a Clever Cloud runtime application. We only activate an option as force https and add some scalability.
Our Grafana Architecture
As Clever Cloud, Grafana furnishes organisation too. Then it’s easy to link both and make it available to our users. Next, we created an API endpoint to connect our Grafana to our console. All data sources exposed (Warp10 and Prometheus) are handled on our side. This means that no users can change them. However we cyclically refresh all tokens. In the same way, we regularly update all custom dashboards we provide.
Everyone features editor rights in their organisations. This means that you can customise all dashboards as you want. We will see, later in this post, how to not generates conflicts with our templates.
Activate the Grafana Beta Organisation
To activate our beta, you need to go to your Clever Cloud organisation view in the Clever Cloud console. Then you will have access to a page called Metrics in Grafana.
Available Dashboards
We built three unique dashboards for you! First we will start by a tour of an organisation metrics. Then we will get more into the details of a runtime view. And finally we will see what we bring for the add-ons. Most graph of all Grafana dashboards contains a small information tile. There, you can retrieve a bit of help and description.
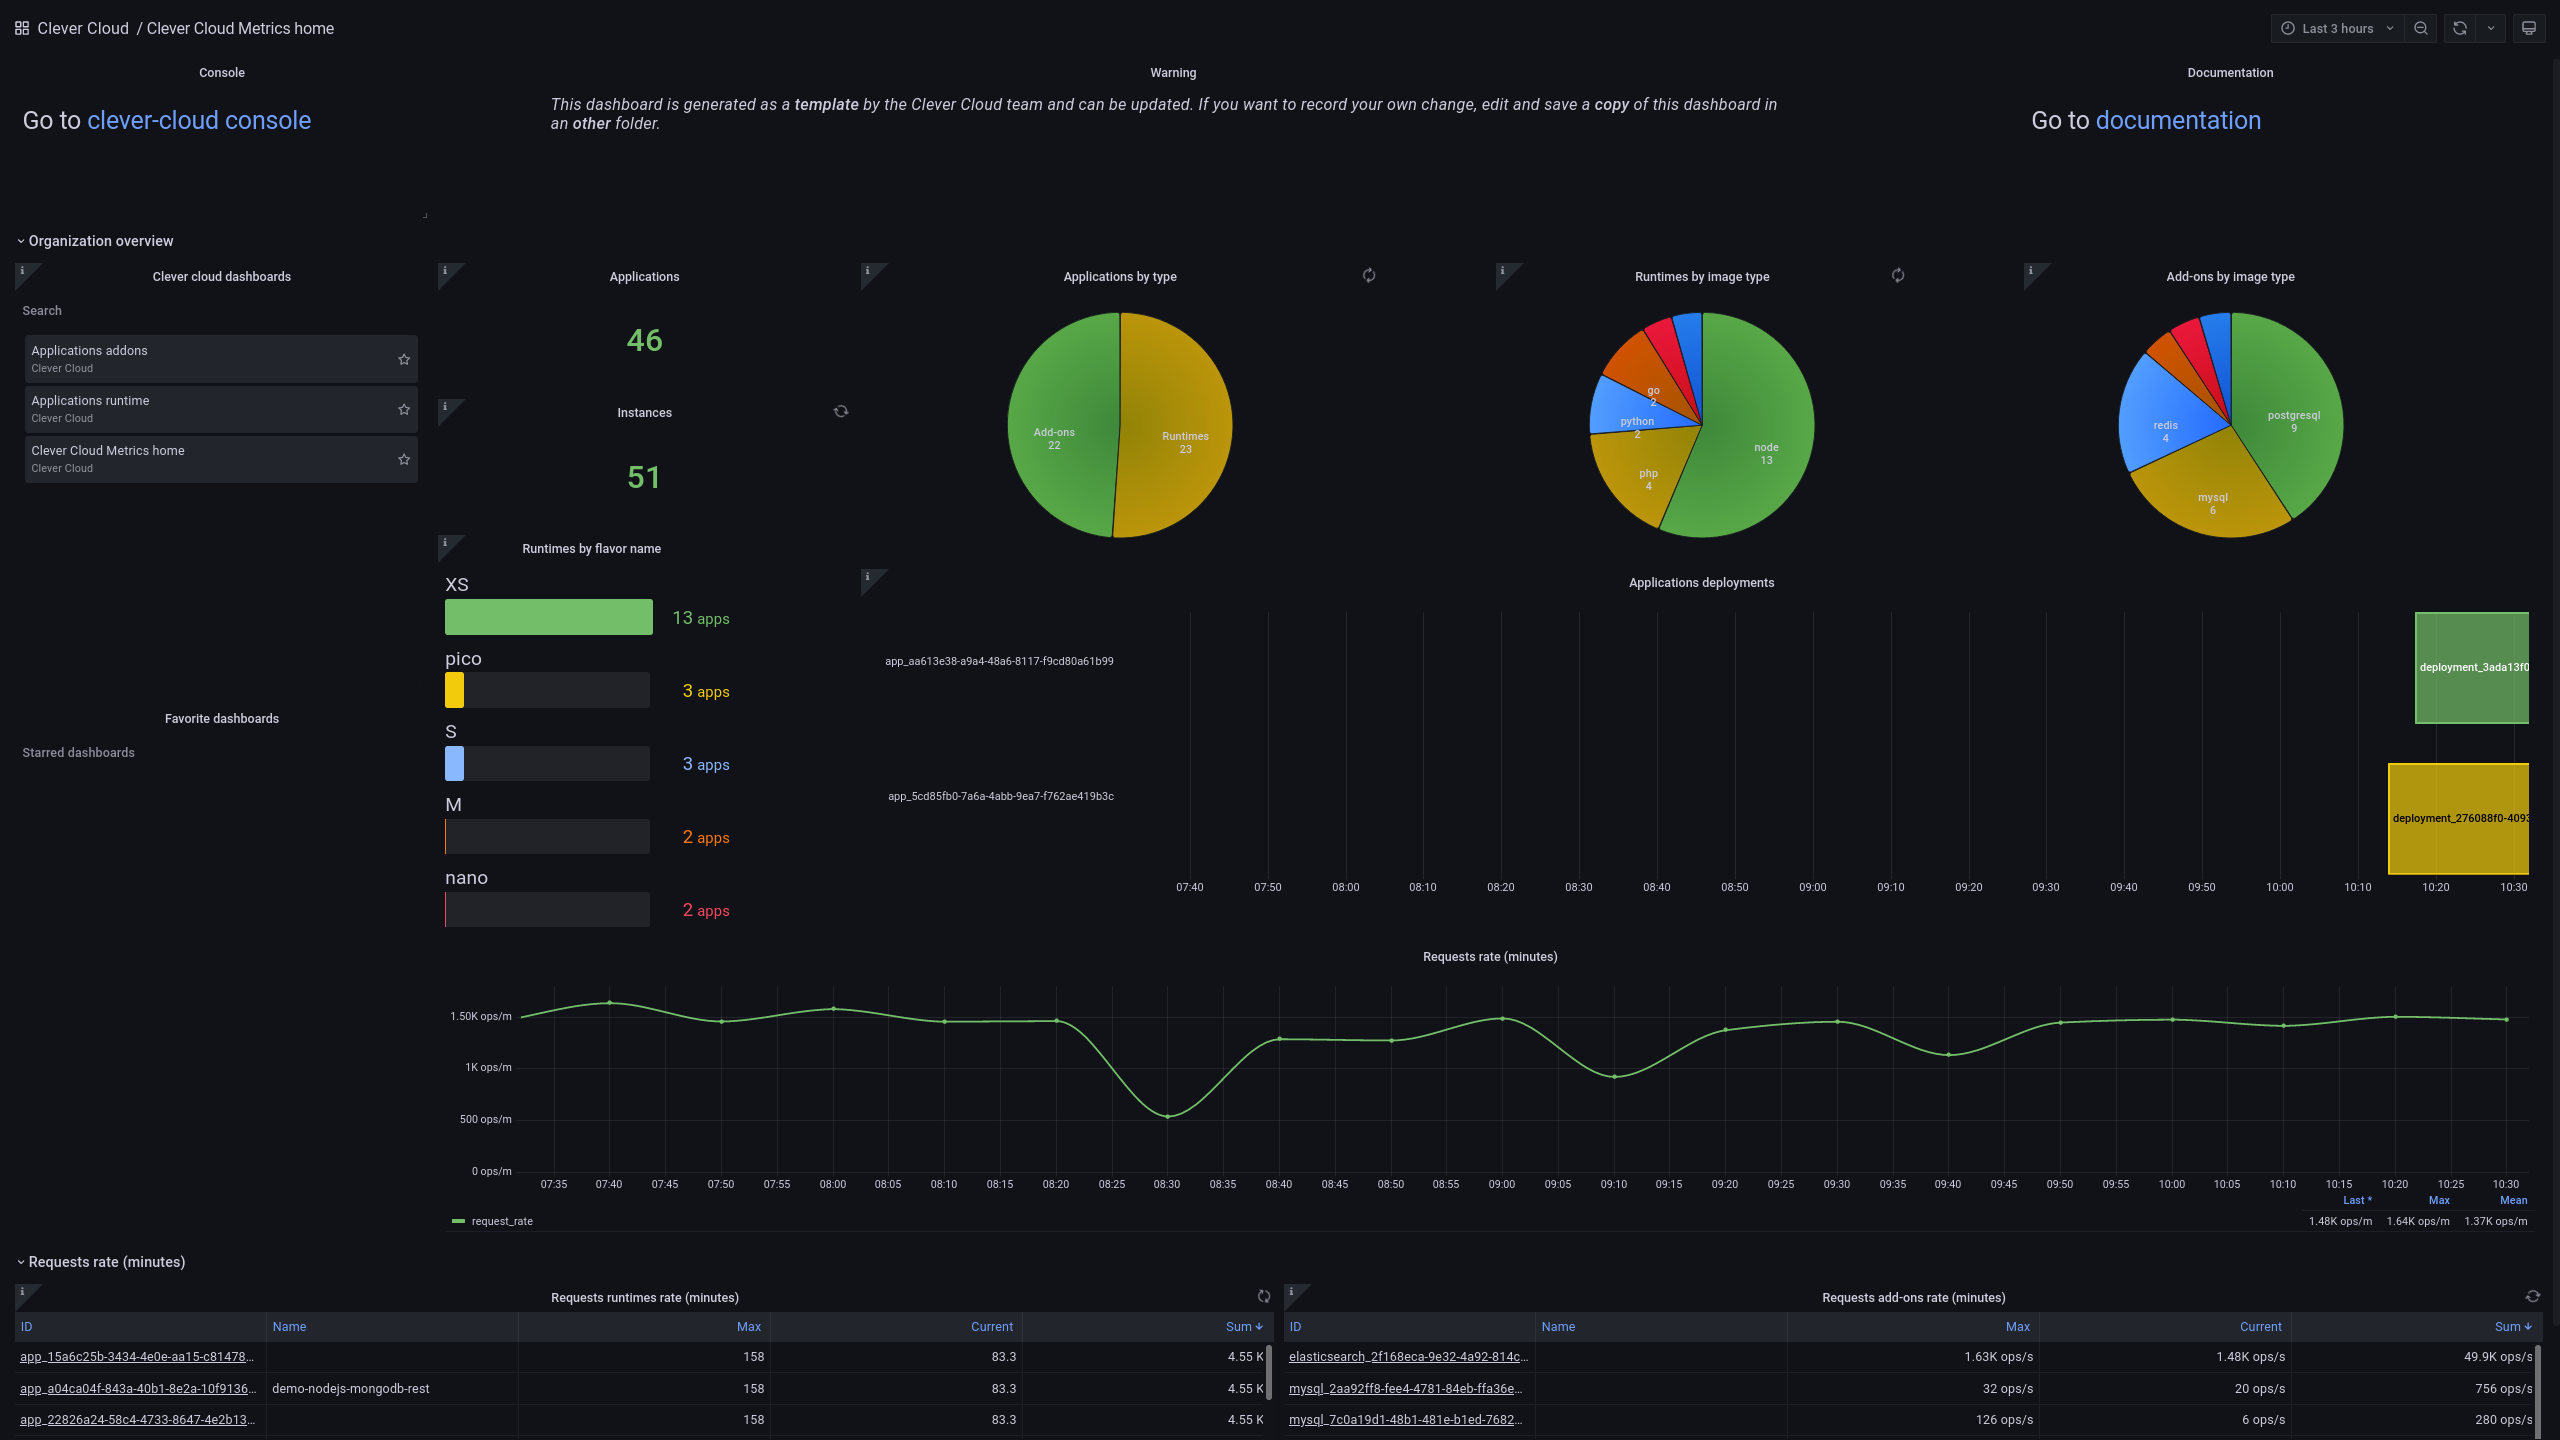
Clever Cloud Organisation
The organisation view is the home dashboard in Grafana. It provides some insights about your organisation. Here, we expose some key information about the applications, the flavours and the image types. Besides, as a home, you will access some links here. You can go to all Clever Cloud template dashboards as well as the ones you set as favourite in Grafana. You can also find out direct link to reach an application.
A tile I want to explain a bit more is the deployment state graph. What is done on this tile? Every new deployment generates a new state. We plot only each one occurring during the Grafana time range. And finally this dashboard includes a metrics counting the average requests rate per minutes, computed from the access logs.
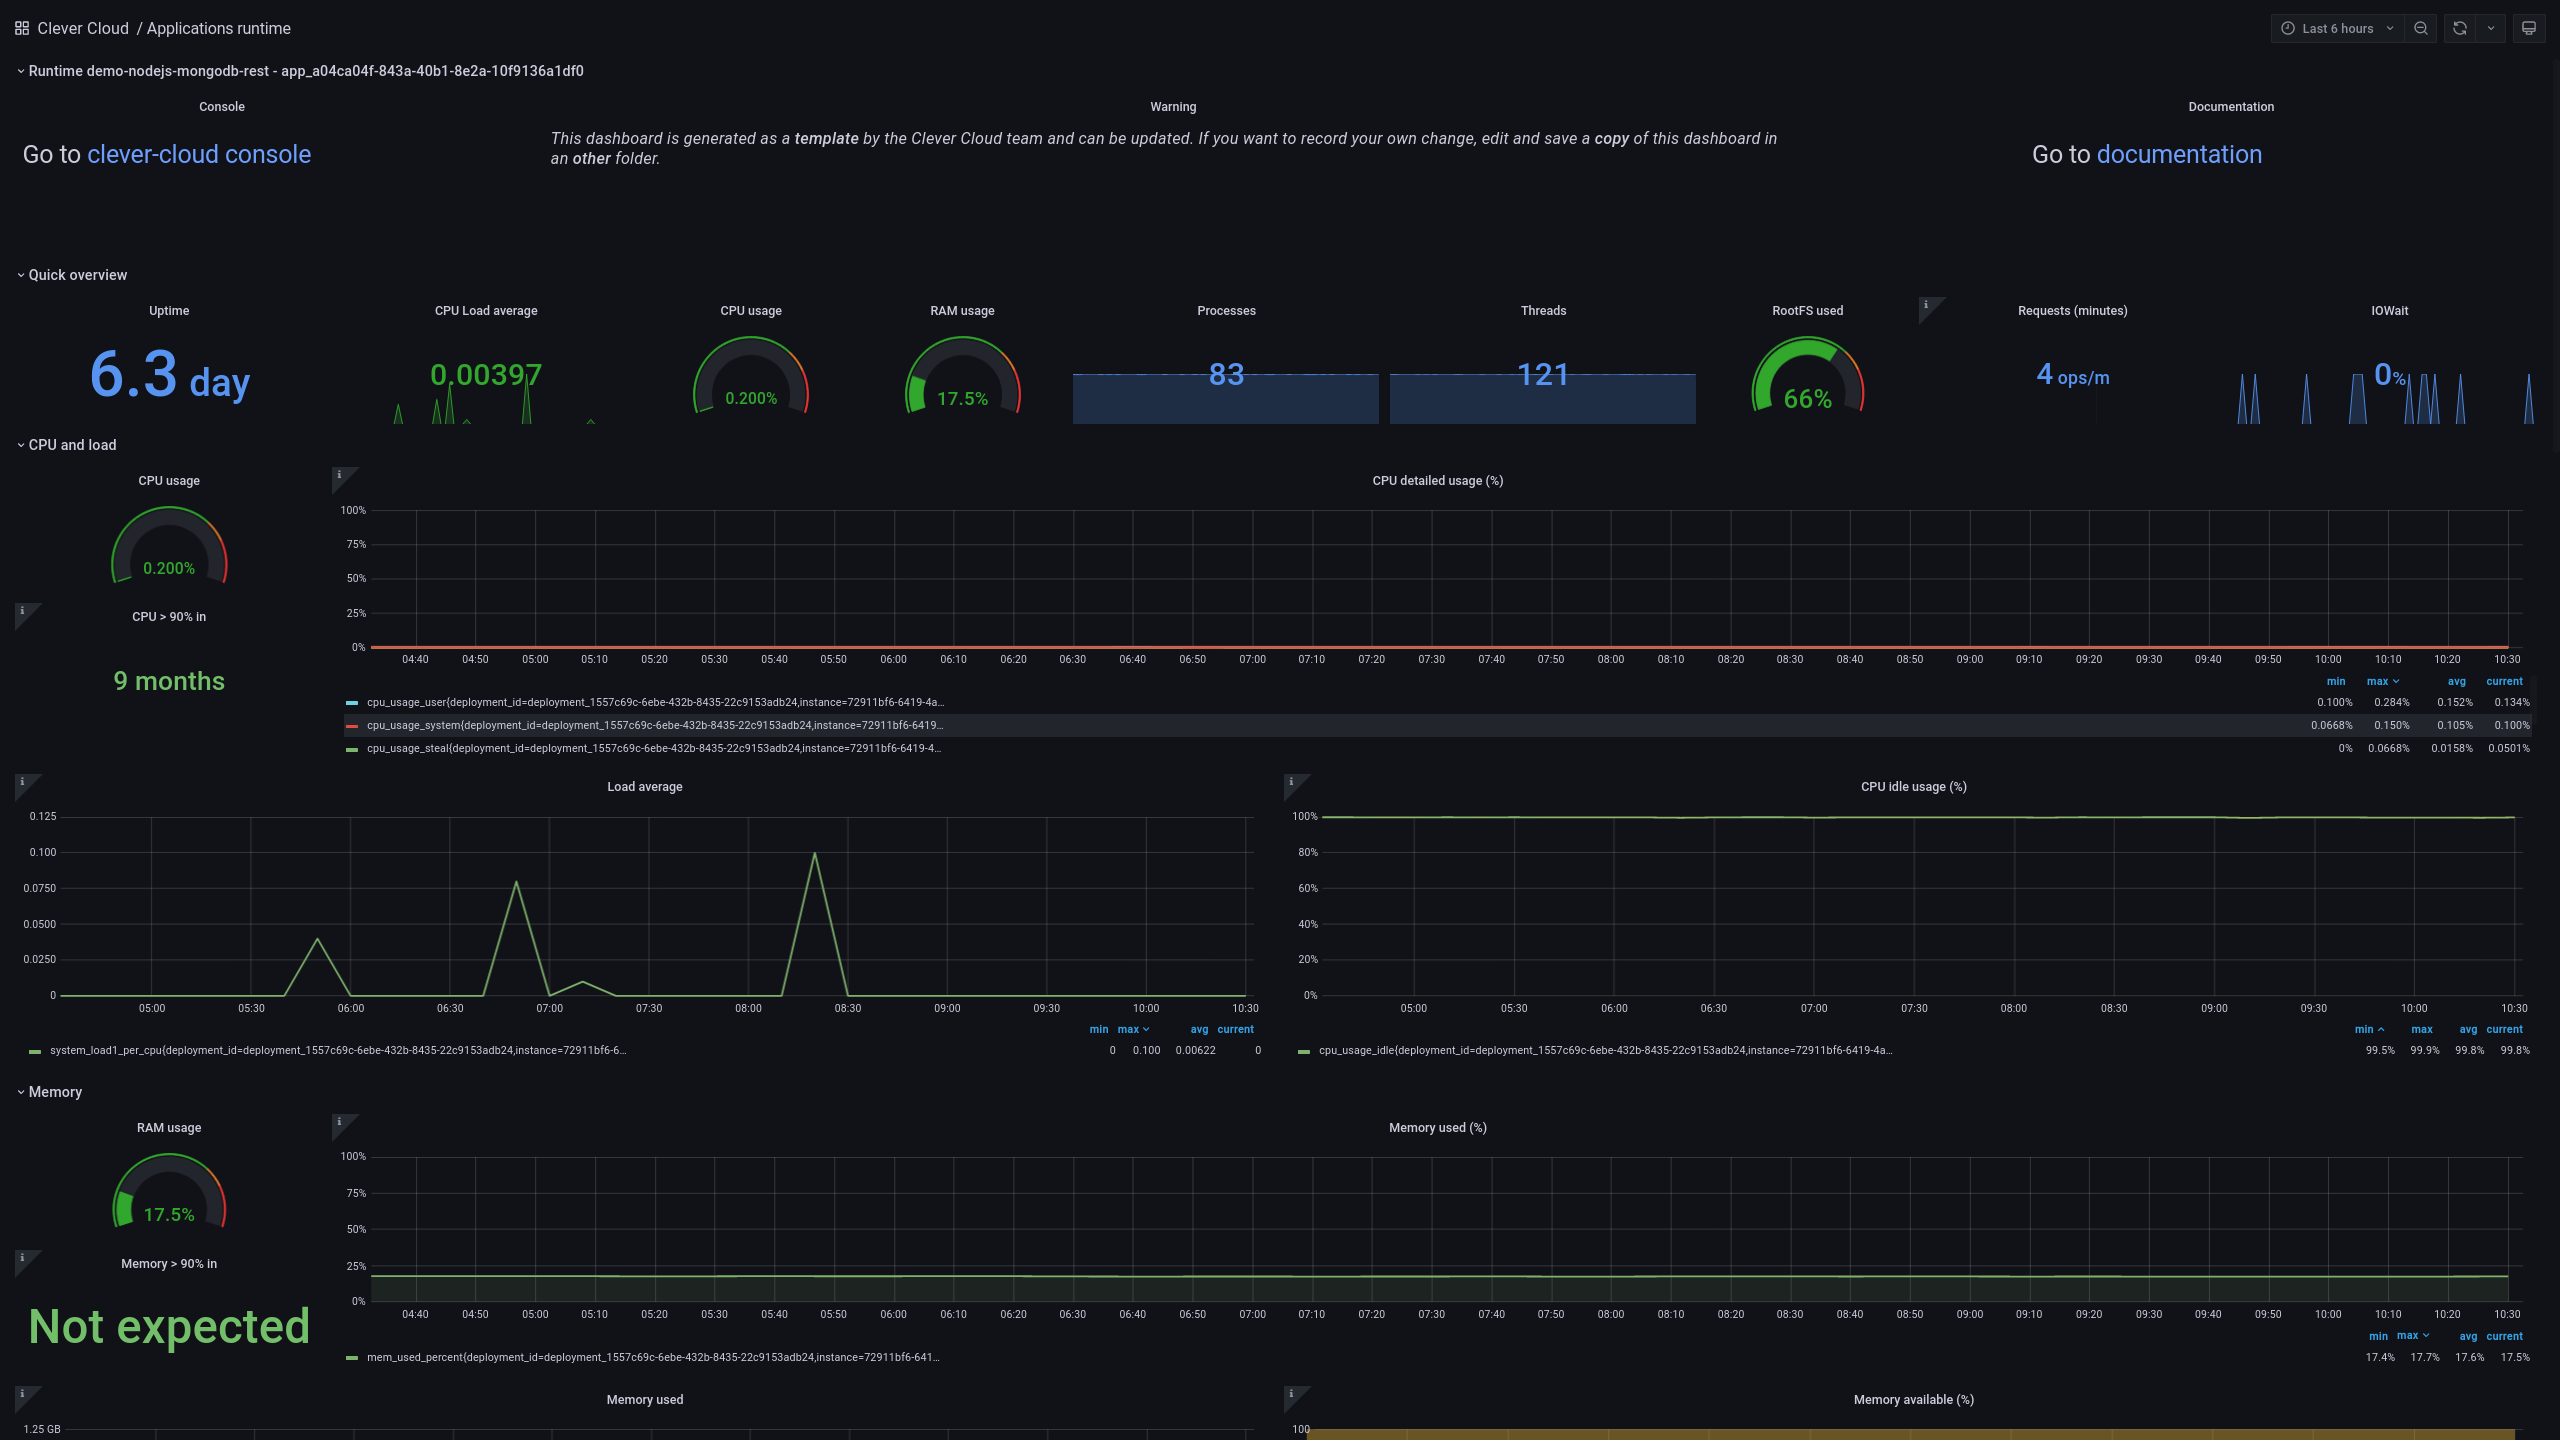
Application Runtime Dashboard
I will now introduce the runtime dashboard. In this dashboard we retrieve several parts. First we start with a quick overview of your application state. Then we will have access to more details sections. Those sections will be about classical system metrics as the CPU, the load, the memory, the disks and the networks. Moreover in each segment, you will find many graphs as the usage or when the resource is saturated. To compute this last metrics, we apply a linear regression.
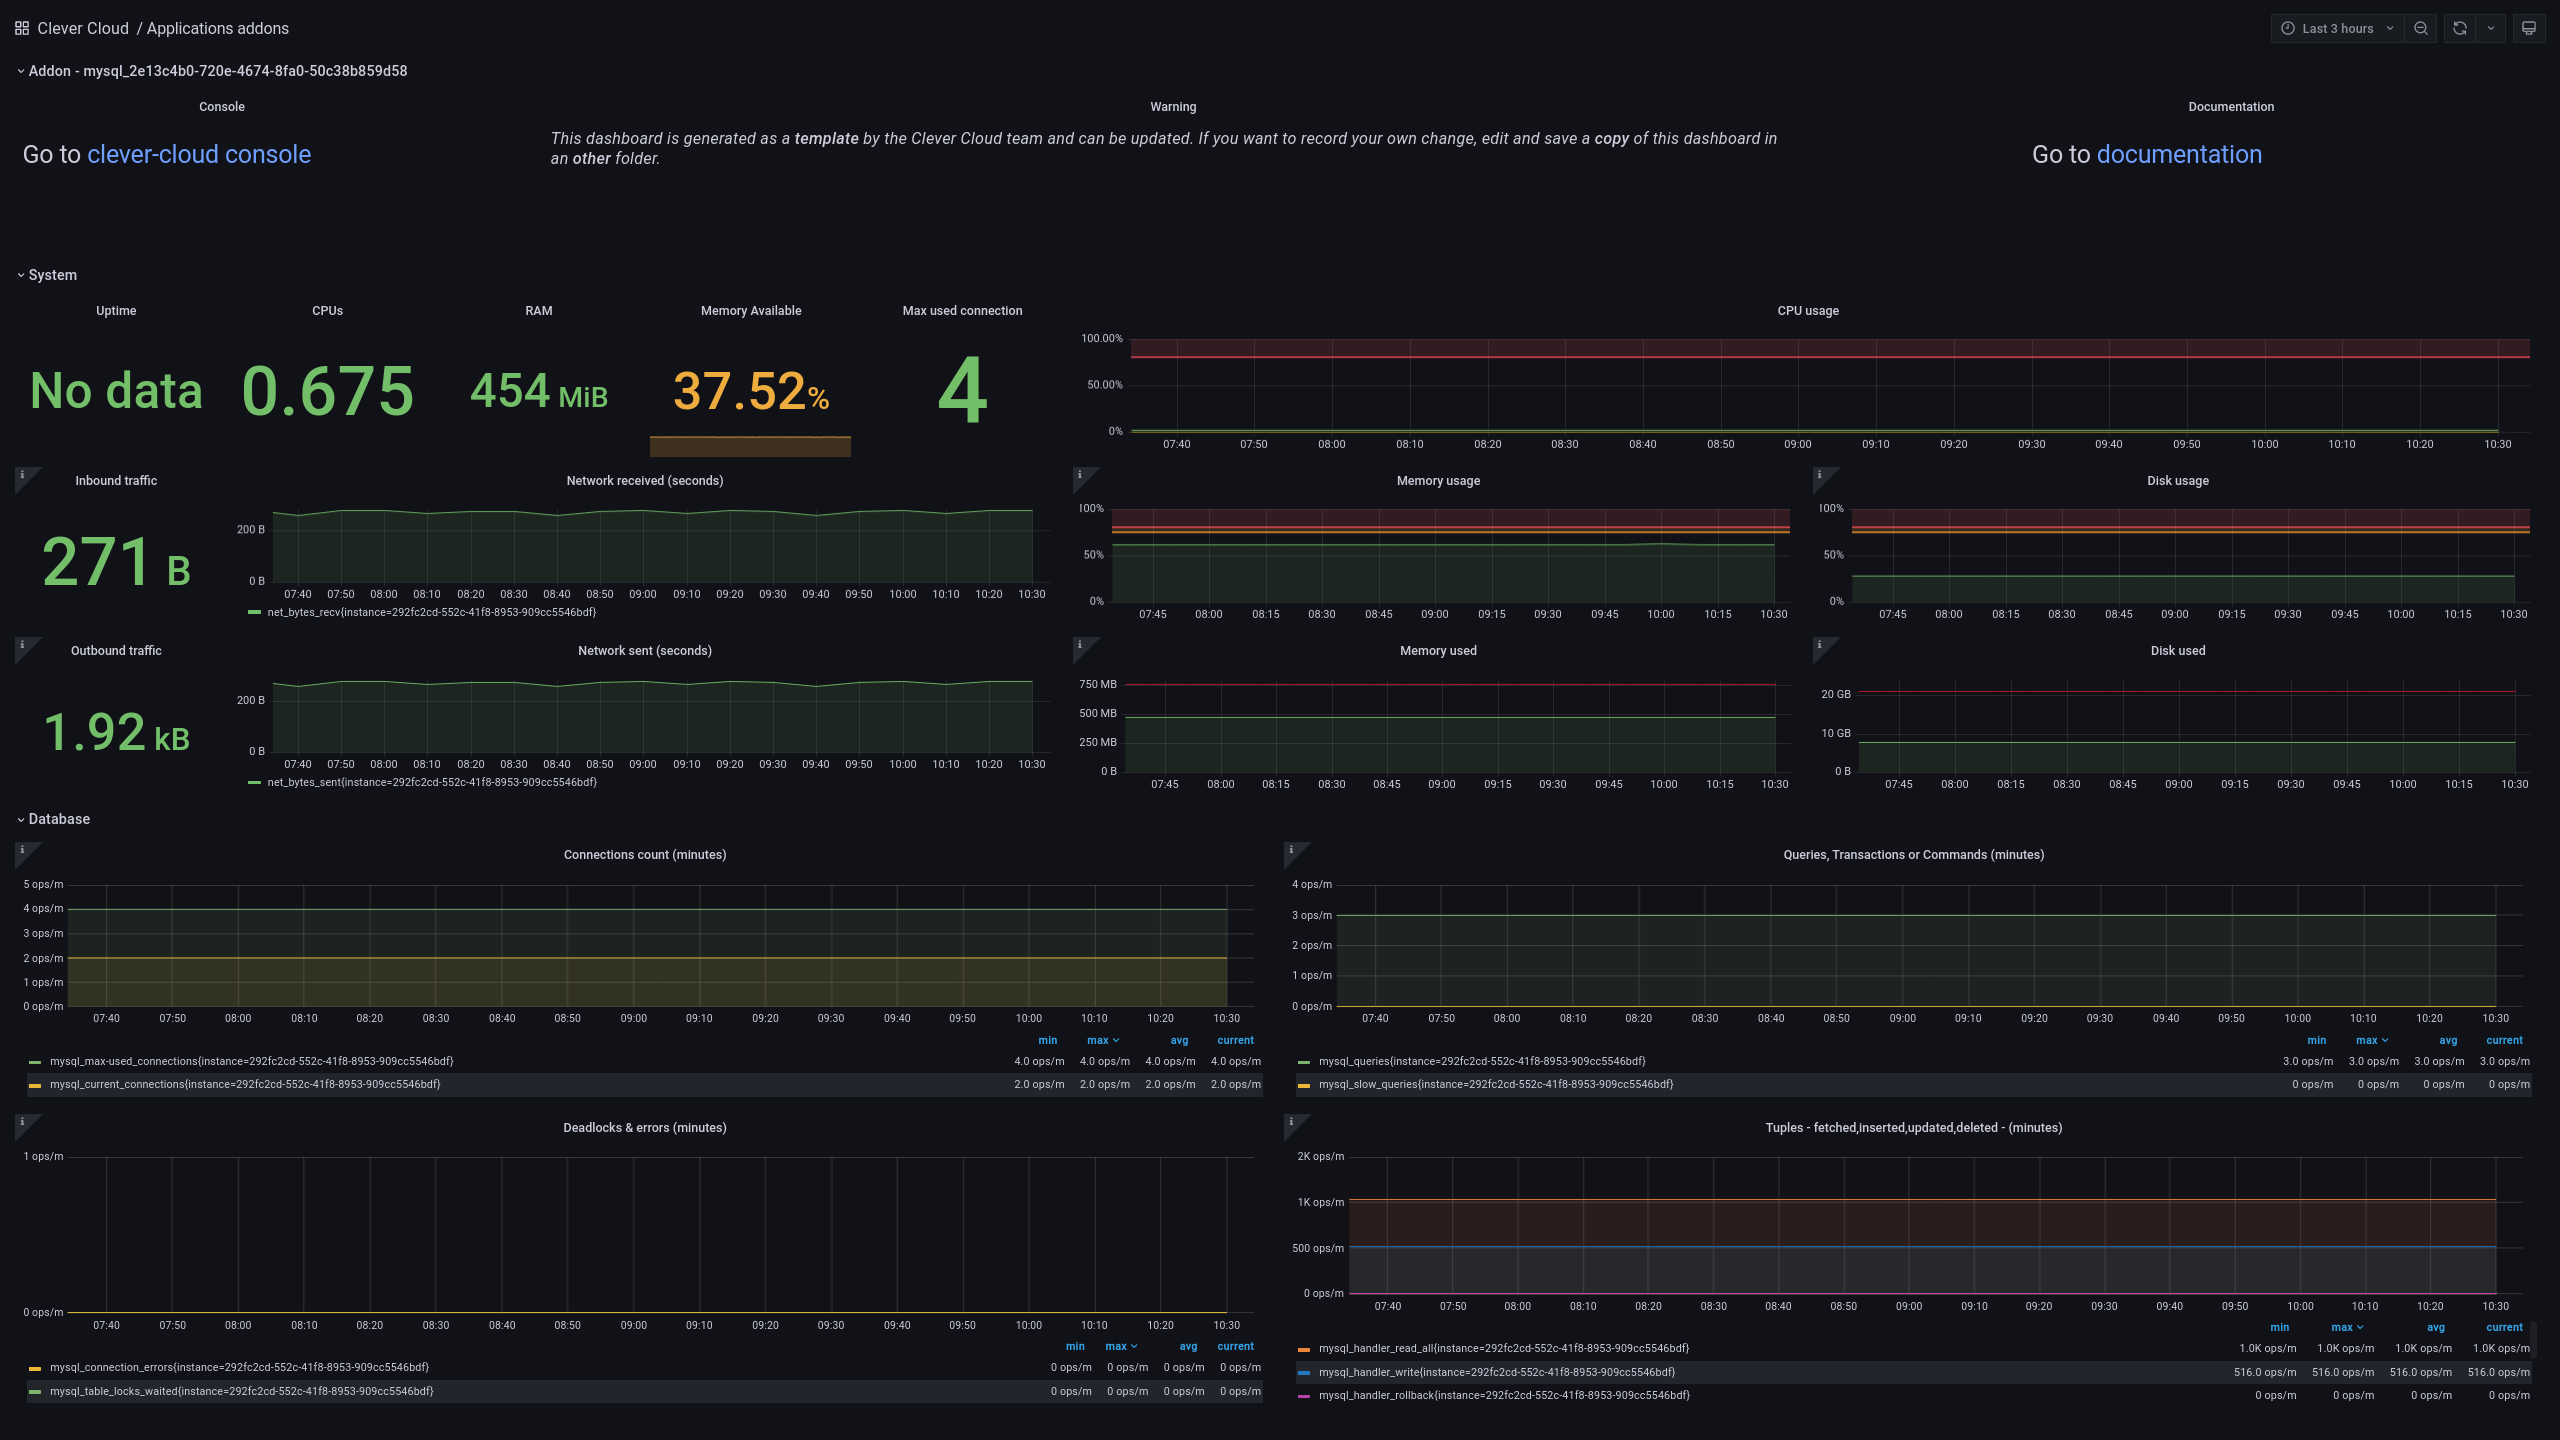
Add-on Dashboard
The last dashboard contains the add-on metrics view. A first panel contains system–related metrics as the CPU, the memory, the disks or the network. A second one show the database metrics. This is where you will retrieve data as connections count, transactions, errors, deadlocks or tuple operations. However we collect custom data on a limited pool of add-on. This means there are only four of them: MySQL, PostgreSQL, Redis and MongoDB.
Customize Your Grafana Organisation
You have full right to edit all dashboard saved in your Grafana organisation. This means you can edit our templates. However we will update them every once in a while. As a result all your dashboards will always be up to date.
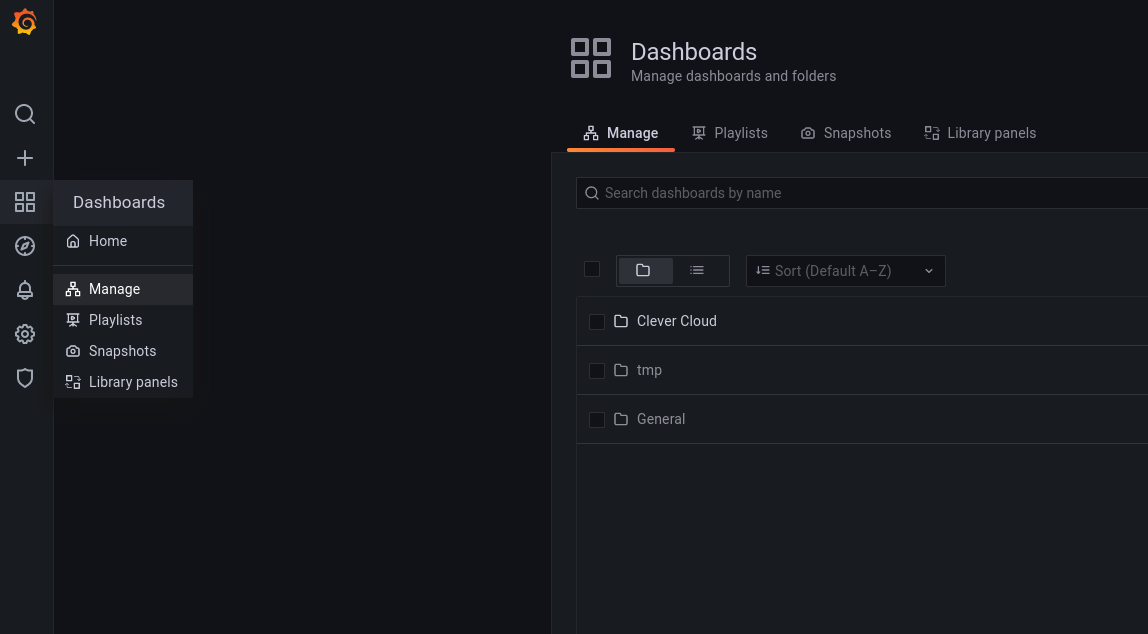
We store all our templates on the Clever Cloud folder. However, you can create custom dashboards anywhere else, we will never update them!
The Grafana manage view lists all folders and files. Besides, this view is helpful to organise and to create new folders!
At any time you can reset our templates. For example in case you made unwanted changes. In that case, you can reach the Grafana page of your Clever Cloud organisation. Then click on reset all dashboards. Finally, all Clever Cloud ones will be back to their initial states.
Share Your Experience
Thank you for reading this post, we will be more than happy to get some feedback! How do you use our available data? Is there something missing for your use case on what we have provided? I hope you will enjoy this new data ride!